School Reopening Visualizations
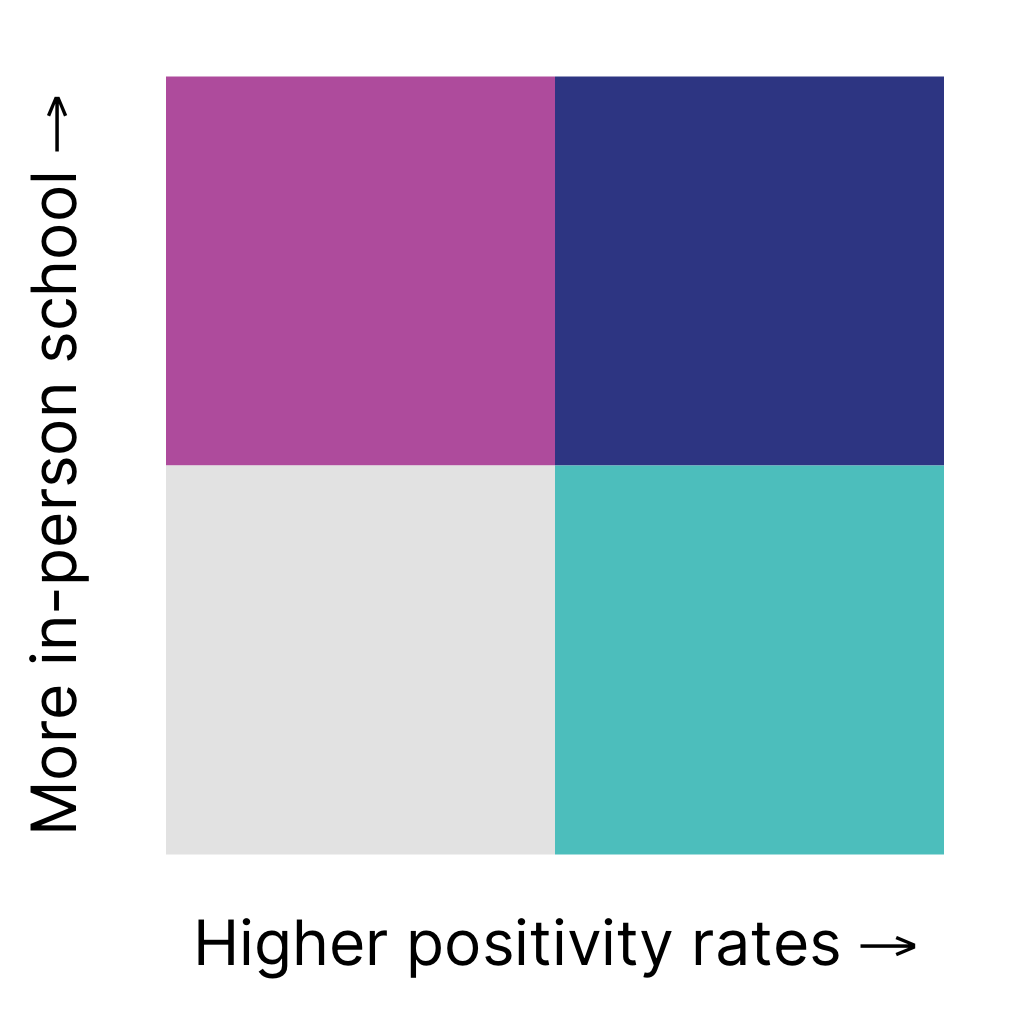
Legend
I’m outputting the legend as a separate object here. Since it applies to both visualizations, you may want to show it early on separately and explain it. Let’s confirm how you want to handle this and then we can decide whether I incorporate it into the visualizations or just have you use this.


Scatterplot
I’ve created two separate scatterplots.
This one can be found at https://school-reopening.netlify.app/interactive-scatterplot-sep-1.html
And this one at https://school-reopening.netlify.app/interactive-scatterplot-oct-15.html